Showing posts with label Mike. Show all posts
Monday, October 17, 2011
New Avid Trader Home
All articles have been moved to www.avidtrader.com. We have a whole new look! We hope you enjoy all the new infomation on Avid Trader!
Friday, October 14, 2011
The Line on Google
Expecting high-flying Google (GOOG) to make a run at its 2011 resistance line, now at 620-21? Yes, but probably not in a straight line.
My intraday pattern work argues for 608-610, followed by a "pullback" to the 580 area, after which GOOG should resume its climb to test its 10-month resistance line.
Thursday, October 13, 2011
SPY Lagging the Q's
Let's notice the relative weakness of the S&P 500 Depository Receipts (SPY) in relation to the PowerShares QQQ Trust (QQQ), exhibited by the juxtapostions of their trading moving averages.
The QQQ has found support at its fastest, upper-most moving average, while the SPY has violated its most "bullish" moving averages, and has spent the last few hours probing its middle postion moving average. The fact that big technology names such as Apple (AAPL), Amazon (AMZN), Intel (INTC), Cisco (CSCO), NetFlix (NFLX) and others are positive today in contrast to the banks and the industrials, which are heavy, accounts for difference.
That said, which index has the uppper hand? My sense from the chart work on AAPL and AMZN is that they are tired and peaking, which if accurate, means that the QQQ (NDX) will fall into line with the SPY (SPX) in the upcoming hours.
Wednesday, October 12, 2011
Betting on the Dollar Versus Yen
Rumors are circulating that in an effort to enable its exporters to compete effectively with China, Japanese authorities are considering some sort of currency "peg," perhaps to a basket of currencies, or vis-a-vis the Yuan, or maybe even in part to gold.
In addition, there are currently heated discussions in Congress about declaring China a "currency manipulator," or otherwise coercing China to allow its Yuan to appreciate faster to enable American business to compete more effectively on a global basis.
Given that, my sense is that there is just too much smoke out there for me not to believe that a major "fire" is about to flash in the foreign exchange markets.
Moreover, it just so happens that my intermediate- and longer-term technical work in USD/Yen is screaming for a powerful upmove in the USD versus a powerful downmove in Yen, which argues strongly that the time has come to add to my long term position in the ProShares UltraShort Yen ETF (YCS).
In addition, there are currently heated discussions in Congress about declaring China a "currency manipulator," or otherwise coercing China to allow its Yuan to appreciate faster to enable American business to compete more effectively on a global basis.
Given that, my sense is that there is just too much smoke out there for me not to believe that a major "fire" is about to flash in the foreign exchange markets.
Moreover, it just so happens that my intermediate- and longer-term technical work in USD/Yen is screaming for a powerful upmove in the USD versus a powerful downmove in Yen, which argues strongly that the time has come to add to my long term position in the ProShares UltraShort Yen ETF (YCS).
Tuesday, October 11, 2011
Bearish Near-Term Scenario for Oil
My intraday pattern work in NYMEX crude oil futures has triggered very preliminary signals that the overnight weakness from 86.09 to 83.97 is the start of a larger correction or period of weakness that projects into the 82.00-81.00 area next.
Only a resumption of strength -- in sympathy with continued strength in equities -- that propels nearby crude above 86.09 will invalidate my near-term scenario and argue for a run at testing 88.00 resistance thereafter.
ETFs to watch are the U.S. Oil Fund ETF (USO) and ProShares UltraShort DJ-UBS Crude Oil (SCO).
Only a resumption of strength -- in sympathy with continued strength in equities -- that propels nearby crude above 86.09 will invalidate my near-term scenario and argue for a run at testing 88.00 resistance thereafter.
ETFs to watch are the U.S. Oil Fund ETF (USO) and ProShares UltraShort DJ-UBS Crude Oil (SCO).
Monday, October 10, 2011
No Damage (Yet) to Downtrends in Gold, Oil, Euro/USD
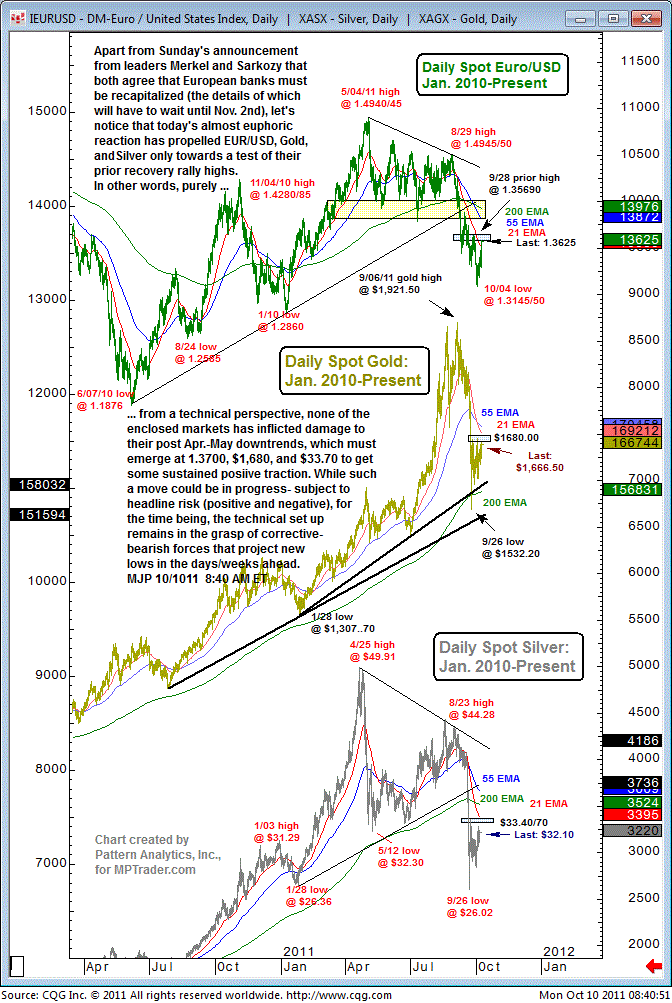
Apart from Sunday's announcement from leaders Merkel and Sarkozy that both agree that European banks must be recapitalized (the details of which will have to wait until Nov 2), let's notice that today's almost euphoric reaction has propelled the Euro/USD as well as gold and silver only towards a test of their prior recovery highs.
In other words, from a technical perspective, none of the enclosed markets has inflicted damage to their post April-May downtrends, which must emerge at 1.3700 (euro/$), $1.680 (gold) and $33.70 (silver) to get some sustained positive traction.
While such a move could be in progress -- subject to headline risk (positive and negative) -- for the time being the technical set-up remains in the grasp of corrective bearish forces that project new lows in the days/weeks ahead.
ETFs to watch are PowerShares DB US Dollar Index (UUP), SPDR Gold Shares (GLD), and iShares Silver Trust (SLV).
In other words, from a technical perspective, none of the enclosed markets has inflicted damage to their post April-May downtrends, which must emerge at 1.3700 (euro/$), $1.680 (gold) and $33.70 (silver) to get some sustained positive traction.
While such a move could be in progress -- subject to headline risk (positive and negative) -- for the time being the technical set-up remains in the grasp of corrective bearish forces that project new lows in the days/weeks ahead.
ETFs to watch are PowerShares DB US Dollar Index (UUP), SPDR Gold Shares (GLD), and iShares Silver Trust (SLV).
Saturday, October 8, 2011
Eyeing Emini S&P Support
The decline in the emini S&P 500 off this morning's high at 1173.75 violated very important near-term support at 1151-1150. This has triggered an initial downside follow-through to 1144.75, likely on the way to test more important support at 1135-1130 next.
If that support zone is violated and sustained, then we should expect downside continuation that revisits the 1090-1070 area, which will represent a retest of last Tuesday's lows.
On the other hand, if it turns out that today's weakness in the index so far is part of a topping process and the e-SPZ manages to claw its way back above 1150-1153, then we should expect additional strength into the 1162-11165 area prior to a more pronounced "rollover."
If that support zone is violated and sustained, then we should expect downside continuation that revisits the 1090-1070 area, which will represent a retest of last Tuesday's lows.
On the other hand, if it turns out that today's weakness in the index so far is part of a topping process and the e-SPZ manages to claw its way back above 1150-1153, then we should expect additional strength into the 1162-11165 area prior to a more pronounced "rollover."
Thursday, October 6, 2011
Cautious on Upmove
With Schlumberger (SLB) up 16.5% since Tuesday morning, forgive me if I tighten my stops aggressively to preserve the bulk of the profit.
The recent wicked volatility in both directions requires traders in the position to continually take profits until the intermediate-term work confirms that a major low AND new bull trend are in progress.
While the Tues-Thurs rally certainly feels good, the dominant downtrend off the May-July top still remains the over-riding influence on the stock indices and on equity prices.
The near-vertical upmove in names like SLB could very well be a vicious short-covering, recovery rally. Unless and until SLB can hurdle the powerful down trendiness shown in the accompanying chart, I will treat the upmove cautiously -- even though my pattern work is becoming extremely constructive about the prospects for upside continuation into an intermediate-term advance.
The recent wicked volatility in both directions requires traders in the position to continually take profits until the intermediate-term work confirms that a major low AND new bull trend are in progress.
While the Tues-Thurs rally certainly feels good, the dominant downtrend off the May-July top still remains the over-riding influence on the stock indices and on equity prices.
The near-vertical upmove in names like SLB could very well be a vicious short-covering, recovery rally. Unless and until SLB can hurdle the powerful down trendiness shown in the accompanying chart, I will treat the upmove cautiously -- even though my pattern work is becoming extremely constructive about the prospects for upside continuation into an intermediate-term advance.
Wednesday, October 5, 2011
S&P 500 Testing Key Resistance
Why did I bail out of my long ProShares Ultra S&P 500 (SSO) position (+7% in a day and a half)? Largely because the e-mini S&P 500 was bumping up against an important one-week resistance line at 1129.00, which in THIS market could elicit a negative reaction.
That said, so far there has been very little weakness after the initial bump against 1129. Should the e-SPZ hurdle and sustain above the resistance line, then my next optimal upside target zone is 1139-1143.
Conversely, any selling pressure from a failed hurdle of the resistance line MUST hold 1120-1115 thereafter.
That said, so far there has been very little weakness after the initial bump against 1129. Should the e-SPZ hurdle and sustain above the resistance line, then my next optimal upside target zone is 1139-1143.
Conversely, any selling pressure from a failed hurdle of the resistance line MUST hold 1120-1115 thereafter.
Tuesday, October 4, 2011
Gold Unfinished on Downside
Just about any and every way I look at my spot gold and the SPDR Gold Shares (GLD) work, I conclude that both have unfinished business on the downside.
In terms of the GLD, all of the action off of the Sep 26 low at 154.19 represents a bearish consolidation-rest period, which when complete should resolve itself in a resumption of weakness that projects towards a test of its 200 DMA's in the vicinity of 150.00. After that I am expecting a powerful upside reversal.
That said, inability of the GLD to hold in and around 150 will argue for downside continuation towards 140-138.
In terms of the GLD, all of the action off of the Sep 26 low at 154.19 represents a bearish consolidation-rest period, which when complete should resolve itself in a resumption of weakness that projects towards a test of its 200 DMA's in the vicinity of 150.00. After that I am expecting a powerful upside reversal.
That said, inability of the GLD to hold in and around 150 will argue for downside continuation towards 140-138.
Monday, October 3, 2011
Shanghai Composite Pressing Against Key Support
Many of the traders and portfolio managers that I speak to are looking at the beleaguered commodity and industrial materials sectors as ripe for reentry on the long side. They're watching companies like Freeport-McMoRan Copper & Gold (FCX), U.S. Steel (X), Alcoa (AA), Walter Energy (WLT), Mosaic (MOS), Deere (DE), and Caterpillar (CAT), for example. However, my enclosed monthly chart of the China Shanghai Composite gives me pause about such a committment right at this time.
When the Shanghai Comp. begins trading for the month of (Oct.) tomorrow, let's notice that it will be pressing against key July 2011 support at 2,320. That level must contain any forthcoming weakness to avert additional weakness that likely will confront much more important support along the up trendline from June 2005, now at 2,250.
The juxtaposition of my sharply declining 7-month EMA against the falling price structure argues strongly that the China equity market could be entering a downside acceleration period that violates significant near- and intermediate-term support en route to a full-fledged test of its October 2008 pivot low at 1,665.
Such a decline will have very negative implications for China demand for commodities and industrial manufactured goods worldwide. The action of the Shanghai Composite during the next several days (weeks) arguably will be the most important gauge of the "health" of the global economy (while most everyone remains fixated on headline risk emanating from Greece, Europe, and the Fed).
When the Shanghai Comp. begins trading for the month of (Oct.) tomorrow, let's notice that it will be pressing against key July 2011 support at 2,320. That level must contain any forthcoming weakness to avert additional weakness that likely will confront much more important support along the up trendline from June 2005, now at 2,250.
The juxtaposition of my sharply declining 7-month EMA against the falling price structure argues strongly that the China equity market could be entering a downside acceleration period that violates significant near- and intermediate-term support en route to a full-fledged test of its October 2008 pivot low at 1,665.
Such a decline will have very negative implications for China demand for commodities and industrial manufactured goods worldwide. The action of the Shanghai Composite during the next several days (weeks) arguably will be the most important gauge of the "health" of the global economy (while most everyone remains fixated on headline risk emanating from Greece, Europe, and the Fed).
Friday, September 30, 2011
Copper Lacking Buyers
So far my target window for a significant low in nearby copper prices in the 3.10-3.06 area is looking pretty accurate. That said, before we run out and load up on copper, it would behoove us to realize that despite holding right in my optimal target zone, the price structure has not yet been able to stage any sort of meaningful rally.
This is a very disconcerting sign, and warns us that it might be prudent to watch copper for a while longer prior to entering the long side. In fact, lack of any buying activity might be telling us that copper still has some unfinished business on the downside.
If that proves to be the case, where could it go? A sustained break below 3.0700 will point nearby copper to 2.9800-2.9200 thereafter.
This is a very disconcerting sign, and warns us that it might be prudent to watch copper for a while longer prior to entering the long side. In fact, lack of any buying activity might be telling us that copper still has some unfinished business on the downside.
If that proves to be the case, where could it go? A sustained break below 3.0700 will point nearby copper to 2.9800-2.9200 thereafter.
Wednesday, September 28, 2011
Positive Divergences for KGC
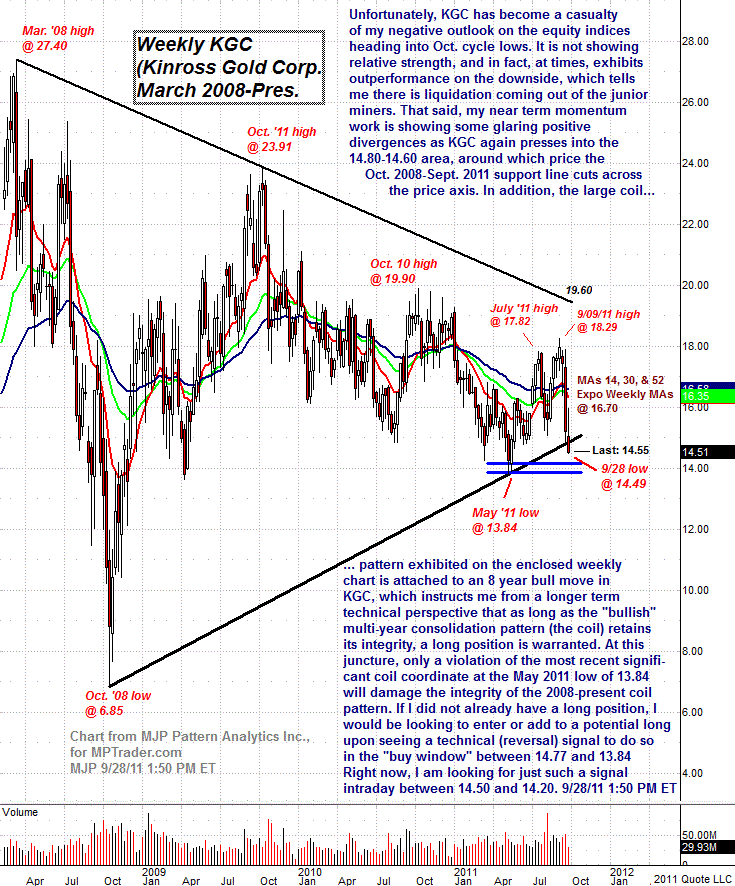
Unfortunately, Kinross Gold (KGC) has become a casualty of my negative outlook on the equity indices heading into the October cycle lows. It is not showing relative strength, and in fact at times exhibits outperformance on the downside, which tells me there is liquidation coming out of the junior miners.
That said, my near-term momentum work is showing some glaring positive divergences as KGC again presses into the 14.80-14.60 area, around which the Oct 2008-Sep 2011 support line cuts across the price axis.
In addition, the large coil pattern exhibited on the enclosed weekly chart is attached to an 8-year bull move in KGC. This instructs me from a longer-term technical perspective that as long as the "bullish" multi-year consolidation pattern (the coil) retains its integrity, a long position is warranted.
At this juncture only a violation of the most recent significant coil coordinate at the May 2011 low of 13.84 will damage the integrity of the 2008-present coil pattern.
Traders may want to look to enter or add to a potential long upon seeing a technical (reversal) signal in the "buy window" between 14.77 and 13.84, or even intraday between 14.50 and 14.20.
Tuesday, September 27, 2011
Significant Correction Still in Progress for AMZN
A look at the pattern developing in Amazon (AMZN), which is one of my indicators for the QQQ and the QID. My near- and intermediate-term pattern and momentum work is warning me that AMZN is in the midst of a significant correction that projects into the 210-205 area prior to completion.
Today's reversal from 234.50 represented the end of an intervening rally that separates two corrective declines. As long as 234.50 is not hurdled, rallies in AMZN should prove to be headfakes prior to the completion of its correction from the Sep 20 high at 244.30 to the next optimal target of 210-205.
Monday, September 26, 2011
Oil Readying for More Downside?
As of this moment, my optimal scenario for the nearby NYMEX oil price calls for a period of stability and/or a recovery rally that grinds into the 80.50-82.00 resistance area prior to another downside pivot that presses the price structure to new lows beneath 75.71 on the way to 70.00-65.00 thereafter.
At the risk of missing such a downleg in the absence of the anticipated recovery bounce, I will watch from the sidelines for a while longer prior to deciding if I should commit funds to a short position -- in the ProShares UltraShort DJ-UBS Crude Oil (SCO) -- into NYMEX price weakness (though always a hazardous strategy to short oil into weakness).
That said, only a rally that sustains above 82.00 will neutralize the imminent threat of another plunge in oil prices and the U.S. Oil Fund ETF (USO).
Friday, September 23, 2011
Support Should Contain KGC Weakness
Although Kinross Gold Corp. (KGC) has endured an 18% decline since its high on September 8, let's notice in the big picture chart that its major support line from the October 2008 low at 6.85 cuts across the price axis at around 14.77 today. As such, this represents the definitive bullish near and medium support plateau.
As long as the 14.77 area contains any additional weakness (another 2.8% from current prices, and 1.8% beneath this morning's pre-open low), the integrity of the multi-year sideways coil pattern will remain intact and viable.
Thursday, September 22, 2011
Eye on AVL
Rare earth names are getting cheap. The only question is how much cheaper before Mr. Market considers them in a fire sale?
For those of us who think that the rare-earth, or strategic resource, space is actually worth something, then we have to take another peak at Avalon Rare Metals (AVL), which is at or very near to its intermediate-term corrective swing target zone of 2.77 off of its April high at 10.11.
Today's low is 2.81, from where AVL has since bounced a bit to 2.90-.95. This is not to say that AVL must hold at or above 2.77, because one look my enclosed channel work suggests that if the overall market continues to head due south, AVL potentially could press into the area of its lower channel support lines between 2.45 and 2.15.
From there, though, I would be expecting a significant technical reversal signal to emerge, assuming AVL remains a viable, real company. With these levels in mind, let's once again keep AVL on our radar screens.
Post-FOMC Reaction Initially Lower
About 30 minutes after the FOMC announcement, and we see that the initial knee-jerk reaction was a swoon from 1190 in the emini S&P 500 to a new intraday and three-day low at 1176.00, which violated key near-term support at 1185.25-1181.50.
However, thus far there has been no downside follow-through. That said, both my hourly pattern and momentum gauges continue to argue for downside towards 1155-1150 next.
Only a climb that hurdles 1194-1197 will begin to neutralize my current outlook, while a climb above 1200-1204 is needed to reverse the near-term polarity altogether.
Tuesday, September 20, 2011
Apple's Vertical Assault
While Apple (AAPL) has rocketed to new all-time highs during the past several sessions, the price action has not been confirmed by momentum. In addition, price strength has propelled the stock 20% above its 200-day moving average, which juxtaposes the two indicators in the rarified air of "blow-off" territory.
That said, unless AAPL doubles back under 410-409, the near-term vertical assault remains viable and could propel AAPL still higher to test its upper channel boundaries between 418 and 426 in the upcoming hours.
Bottom line: Only a break below 410-409 will trigger warning signals, while a decline that breaks 406 is needed to confirm a near-term peak in AAPL.
Monday, September 19, 2011
Downleg in Oil
Nearby NYMEX crude oil finally proved the chart work correct as it plunged from the upper portion of its September congestion pattern (89.00-90.00) to the lower portion (86.00-84.00). The decline from last Thursday's lower recovery high at 90.15 into this morning's low at 84.93 has the look and structure of a completed downleg.
If accurate, this means that a period of upside backing and filling towards its key near-term breakdown area (86.50-87.50) could be in store in the upcoming hours. It is for this reason we exited our inverse (short) position in the ProShares UltraShort DJ-UBS Crude Oil (NYSE: SCO).
Apart from this shorter-term trading strategy and outlook, my longer-term work on NYMEX crude argues strongly that a counter-trend recovery period from the August 8 low at 75.71 ended at the September 13 high at 90.52 and that a new downleg has commenced that should revisit and likely break the August low. ETF traders may want to keep an eye on the U.S. Oil Fund ETF (USO).
Subscribe to:
Posts (Atom)